9% and 6%: Breaking Down the State-Approved Con Ed Rate Hike of 2026
- Ray DiFrancesco III
- Feb 24
- 6 min read

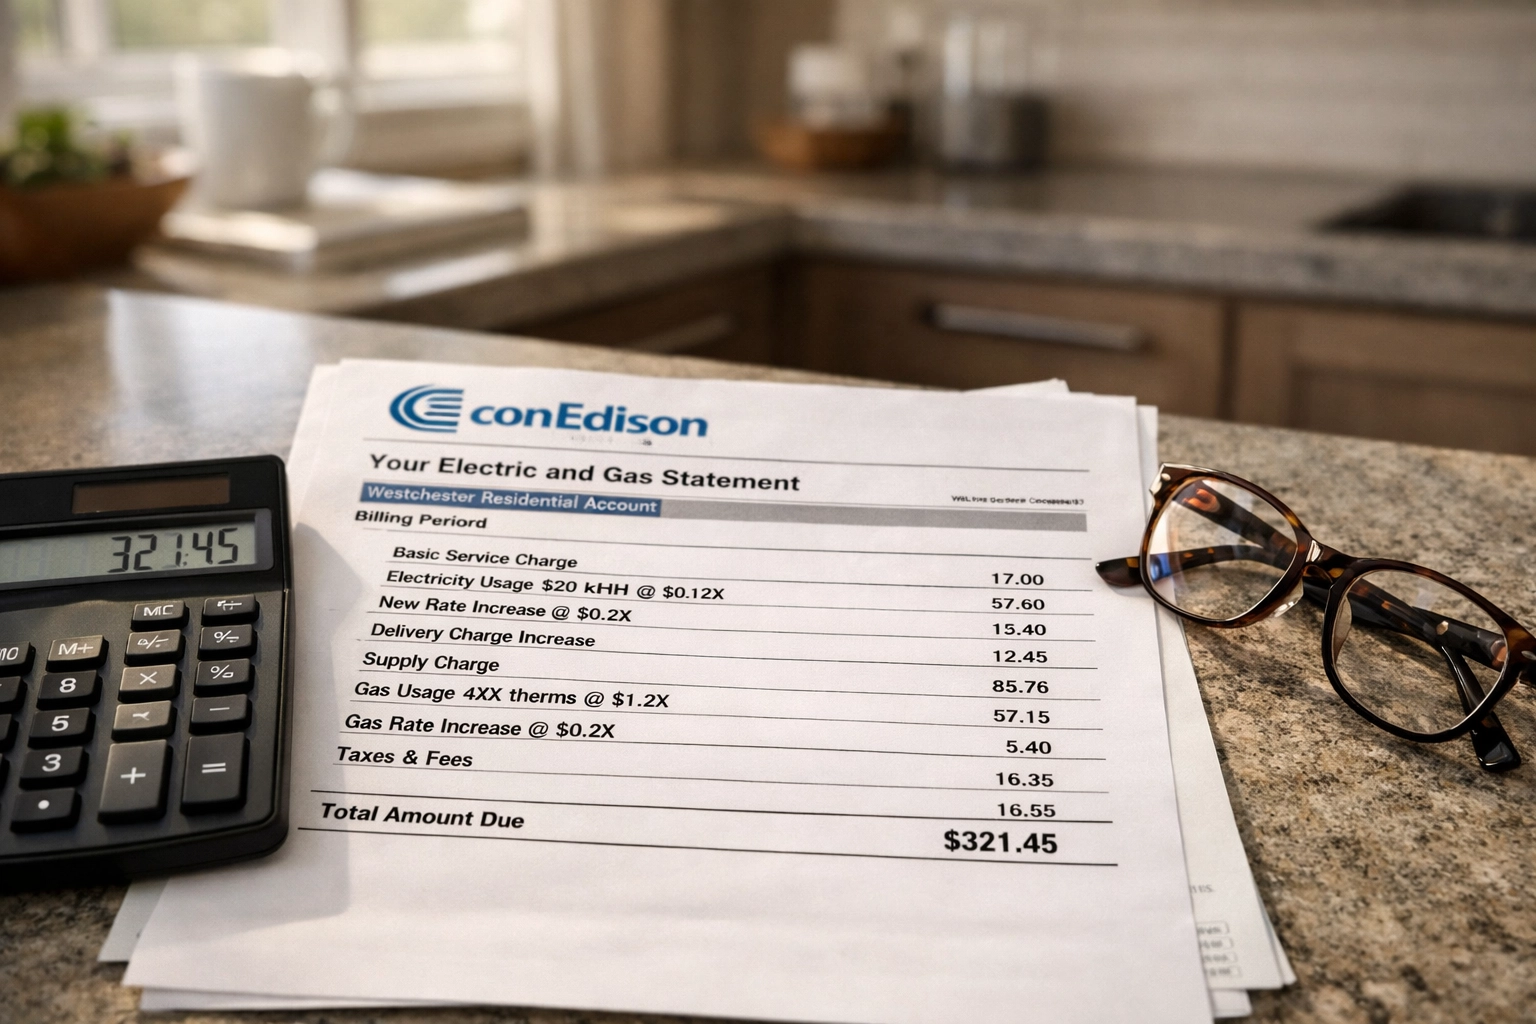
Have you opened your utility bill recently and wondered why the numbers keep climbing, even when you're using less energy? If so, you're not alone. On January 16, 2026, the New York State Public Service Commission quietly approved a three-year rate increase plan for Con Edison customers that will fundamentally reshape what New Yorkers pay for electricity and gas through 2028.
The headlines simplified it to "9% and 6%": but those percentages only tell part of the story. What many Hudson Valley and Westchester homeowners don't realize is that these aren't one-time increases. They're compounding, multi-year hikes that will stack on top of each other, year after year, creating a cascading effect on your monthly bills that goes well beyond what the initial percentages suggest.
In this post, we'll break down exactly what the Public Service Commission approved, how the compounding math actually works, what you'll pay in real dollars, and: most importantly: what options you have to take control of your energy costs before the full weight of these increases hits your wallet.
What the Public Service Commission Actually Approved
According to reporting from THE CITY and News 12, the approved Con Edison rate plan includes both electric and gas increases spread across three years. Here's the breakdown:
Electric Rate Increases (9% Total):
2026: 3.5% increase
2027: 3.2% increase
2028: 3.1% increase
Actual Total: Approximately 9.8% over three years
Gas Rate Increases (6% Total):
2026: 4.4% increase
2027: 5.7% increase
2028: 5.6% increase
Actual Total: Approximately 15.7% over three years

Notice something? The gas increases are labeled as "6%" total, but when you add up the annual percentages, the real number is closer to 15.7%. This is where the compounding effect comes into play: and where most homeowners get blindsided.
The Compounding Effect: Why Simple Math Doesn't Apply
The most critical aspect of these rate increases isn't the individual percentages: it's how they build on each other. These aren't simple additions. Once a higher rate is approved, it becomes the new baseline for the next year's increase.
Here's what that means in practice:
Let's say your electric rate in 2025 was $100. In 2026, you pay 3.5% more on that $100, bringing your rate to $103.50. That's straightforward enough. But in 2027, you don't pay 3.2% more on the original $100: you pay 3.2% more on the already-increased $103.50. Your rate becomes $106.81. Then in 2028, the 3.1% increase is calculated on $106.81, not the original $100, bringing you to $110.12.
The result? What sounds like a 9% total increase is actually closer to 10% when compounding is factored in. For gas customers, the effect is even more pronounced, with the "6%" headline turning into nearly 16% in reality.
This compounding structure is standard practice in utility rate cases, but it's rarely explained clearly to customers: and that lack of transparency is precisely what makes these increases so difficult to anticipate and plan for.
What You'll Actually Pay: Real Dollar Amounts
Let's translate those percentages into actual monthly costs. According to the approved rate plan, here's what a typical New York City resident can expect:
Electric Bill Increases:
2026: $4 more per month (based on 280 kWh usage)
2027: $3.55 more per month
2028: $3.58 more per month
Gas Bill Increases:
2026: $5.73 more per month
2027: $19.32 more per month
2028: $15.08 more per month
If you're a Con Ed customer using both electricity and gas, you're looking at an additional $9.73 per month in 2026 alone: that's $116.76 per year. By 2027, that monthly increase jumps to $22.87, or $274.44 annually. And by 2028, you'll be paying roughly $18.66 more per month, or $223.92 per year, compared to your 2025 baseline.
Over the three-year period, the cumulative increase for a dual-fuel household could exceed $600: and that's using the utility's "typical usage" assumptions. If you have a larger home, older HVAC systems, or a family that uses more energy than average, your actual increases will be significantly higher.
Why These Increases Were Approved
To be fair, Con Edison didn't get everything it asked for. The utility originally requested 11.4% for electric and 13.3% for gas over the same three-year period. Stakeholder negotiations and Public Service Commission oversight brought those figures down to the current approved levels.
So where is all this money going? According to the approved rate case filings, Con Edison cited several justifications:
Aging grid infrastructure: Much of New York's electrical grid dates back decades and requires significant modernization
Electrification initiatives: As the state pushes toward electric vehicles and heat pumps, the grid needs capacity upgrades
Transmission upgrades: High-voltage transmission lines need reinforcement to handle growing demand
Grid hardening: Severe weather events: hurricanes, ice storms, heat waves: require the utility to invest in resilience measures
Regulatory mandates: State-level climate goals and reliability standards require costly system improvements
These are legitimate infrastructure needs. The problem isn't that the grid requires investment: it's that the cost of those investments is being passed directly to customers through ever-increasing rates, with no end in sight.
What This Means for Hudson Valley and Westchester Homeowners
If you live in Westchester, Rockland, Orange, or Dutchess County, you're in Con Edison's service territory: and these rate increases apply to you. But here's what makes this especially challenging for Hudson Valley homeowners: your energy costs were already among the highest in the nation before these increases were approved.
According to the Empire Center's Energy Data Bulletin, New York residents pay electric rates that are 49% above the national average: the 8th highest in the country. Now, with these multi-year increases locked in, that gap will only widen.
For context, the average New York electric rate is approximately 19 cents per kilowatt-hour, compared to the national average of around 11 cents. When you add another 9-10% over the next three years, you're looking at rates pushing toward 21 cents per kWh by 2028: nearly double what many other states pay.
And unlike some states where utility costs are offset by lower taxes or housing costs, New York homeowners face high property taxes, insurance premiums, and cost of living across the board. Energy is just one piece of a broader affordability crisis: but it's a piece you can actually do something about.
The Rate Pain Engine Isn't Slowing Down
Unfortunately, these 2026-2028 increases aren't the end of the story. A recent national PowerLines Report analyzing utility rate case filings across the country found that utilities are requesting double the rate increases compared to previous years. The report identified $31 billion in pending rate hike requests nationwide, signaling that the "rate pain engine" is only getting started.
In New York, that trend is already visible. Con Edison has signaled that additional rate cases will likely be filed in future years to cover ongoing infrastructure projects, renewable energy integration, and grid modernization mandates. The Public Service Commission has also approved or is reviewing rate increases for National Grid, NYSEG, and other major utilities serving different parts of the state.
The takeaway? If you're a New York homeowner waiting for utility rates to stabilize or decline, you may be waiting a very long time.
Taking Control: What You Can Do Right Now
The good news is that you're not powerless. While you can't control what the Public Service Commission approves or what Con Edison charges, you can control how much energy you buy from the grid: and that's where solar energy becomes a viable, long-term hedge against rising utility costs.
When you install solar panels, you generate your own electricity during daylight hours, reducing the amount of power you need to purchase from Con Edison. In many cases, a properly sized solar system can offset 70-100% of your annual electric usage, insulating you from rate increases like the ones just approved.
Better yet, New York offers some of the strongest solar incentives in the country:
Federal Investment Tax Credit (ITC): 30% of your system cost back as a tax credit
NY State Solar Tax Credit: Up to $5,000 in additional state credits
Net Metering: Sell excess solar power back to the grid at retail rates
Accelerated Depreciation: For businesses, solar systems qualify for MACRS depreciation
For Hudson Valley and Westchester homeowners, these incentives can reduce the upfront cost of solar by 40-50%, making the payback period as short as 5-7 years in many cases. After that, you're generating free electricity while your neighbors continue paying escalating rates year after year.
If you're curious about what a solar system might look like for your home and what kind of savings you could achieve, a free energy consultation is a smart first step. You'll get a customized assessment of your energy usage, roof suitability, and projected savings: with no obligation.
The Bottom Line
The 9% electric and 6% gas rate increases approved by the New York State Public Service Commission aren't just numbers on a page: they're real costs that will compound over time, adding hundreds of dollars to your annual energy bills. And with utility rate hikes showing no signs of slowing down, the question isn't whether your costs will keep rising: it's how much control you'll have over them.
For homeowners in Westchester and the Hudson Valley, understanding these increases is the first step. Taking action to reduce your dependence on the grid is the second. Whether that means exploring solar, upgrading to energy-efficient appliances, or simply becoming more informed about how your utility costs are calculated, now is the time to make a plan.
Want to learn more about how solar could offset these rising costs for your home? Book a free consultation with our team at RJD Solutions, or explore our guide on understanding local utility rate increases to dive deeper into the numbers.
Stay connected with RJD Solutions for more insights on solar energy and utility cost trends: 📘 Follow us on Facebook 📸 Follow us on Instagram
Comments